Mapping the planets with Rust+WebAssembly+JavaScript+Canvas
05 May 2018I wanted to think of a small-ish project I could work on that uses Rust, WebAssembly, and JavaScript. One of the projects I thought would be fun to make while here at RC is something that gives the ability for people to map out where all the planets were in relation to Our Spaceship Earth on the day they were born. (This is like, an astrology thing, which I don’t really throw down with, but I am really into understanding and identifying and computationally recreating elements of mysticism, so this is like 100% up my alley in that regard). There’s a really great Wordpress plugin that will do all of this for you and also create a picture of what it looks like, which is what I wanted to do except in JavaScript. Oh, here’s the library, it’s great. Anyway, turns out this stuff is actually pretty hard and involves a lot of M A T H, which I’ve already articulated as a thing that I just never learned because I was homeschooled in South Carolina and straight up didn’t feel like learning it.
But I came across a library in Rust that does these projections and calculations for where planets will be at any given point in time (among other things), based on a lot of whitepapers and solid, well-studied algorithms. It’s called astro and it’s super rad too!
I already wrote about my long-winded journey to finding a great library for working with this medley of programming languages, and then after that I had to actually start creating stuff and then moving it all around. I gathered some coordinates from the Rust sides of things, and then I set up the HTML canvas on the JavaScript side of things, and then took some time to put them all together.
I moved very slowly, then I paired with Rory (who is building a lil theremin right now, check it owwtttt) and went super-fast. 🚀
First up, we took the data and tried * 180 / Math.PI to translate radians into degrees, because we thought the heliocentric coordinates of latitude and longitude, which were set as radians, just needed to be turned into degrees. We assumed latitude was the place in relation to the sun and the longitude was the distance from the sun (at some point, naming these angle and distance).
This was wrong, though. Then, we translated the heliocentric coordinates into Cartesian, again relying on latitude and longitude for x and y, using this math:
x = lat × cos( long )
y = lat × sin( long )
But that wasn’t right either. Finally we bucked down and realized the “rad_vec” parameter that came along with the latitude and longitude wasn’t just talking about how cool the radius of each planet was, and that it was actually relevant. We read some crucial deetz about the Ecliptic coordinate system and things fell into place. We had to translate the 3D coordinates of our solar system into a 2D canvas plane! I could have turned Canvas into a 3D zone, but maybe… later.
This meant we had to do this kind of math:
x = rad*Math.cos(long)*Math.cos(lat)
y = rad*Math.cos(lat)*Math.sin(long)
This was looking very close to right, but also still not exactly right? I spied some important details about the Ecliptic coordinate system which led me here and to a tiny bit more math.
The final puzzle piece to get this working right was the rotate everything by 90 degrees counterclockwise. Apparently “This is correct for conventional Cartesian coordinates, where the Y-axis points up.” When I set Canvas from default coordinates (0,0 is top-left corner) to “Cartesian” coordinates, I set (0,0) to the center but didn’t do any flipping.
Here is the (not very visually appealing) draft of what is produced on the page:
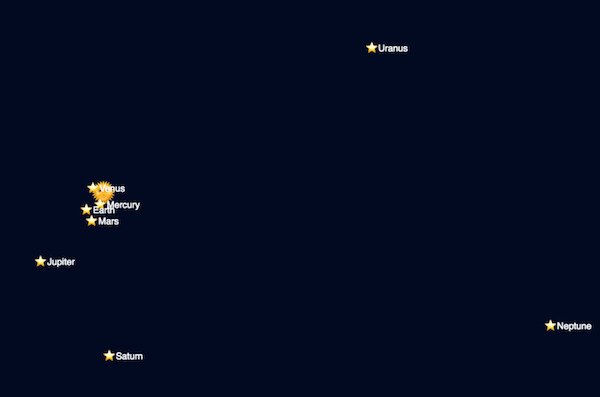
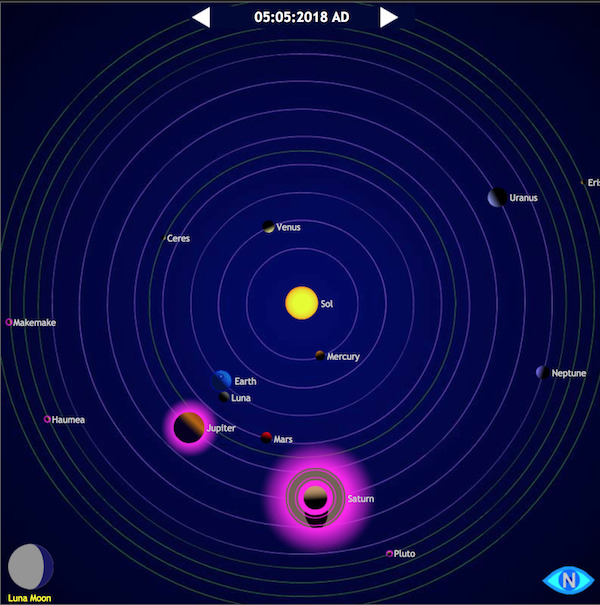
Comparing this to The Planets Today…
And that’s that! The data is now successfully displaying on the page. This is a work in progress. I still need to:
- allow user input to specify date
- not hardcode the date and instead show current date/time by default
- make planets look great
- fake the distance so Neptune isn’t so damn far away
- fake the distance so Mercury isn’t so damn close to the emoji-sun
- get Pluto on the map even if it’s not a planet anymore
Update: I did all of these except poor Pluto. Sorry bud.
The source code is up and available here!