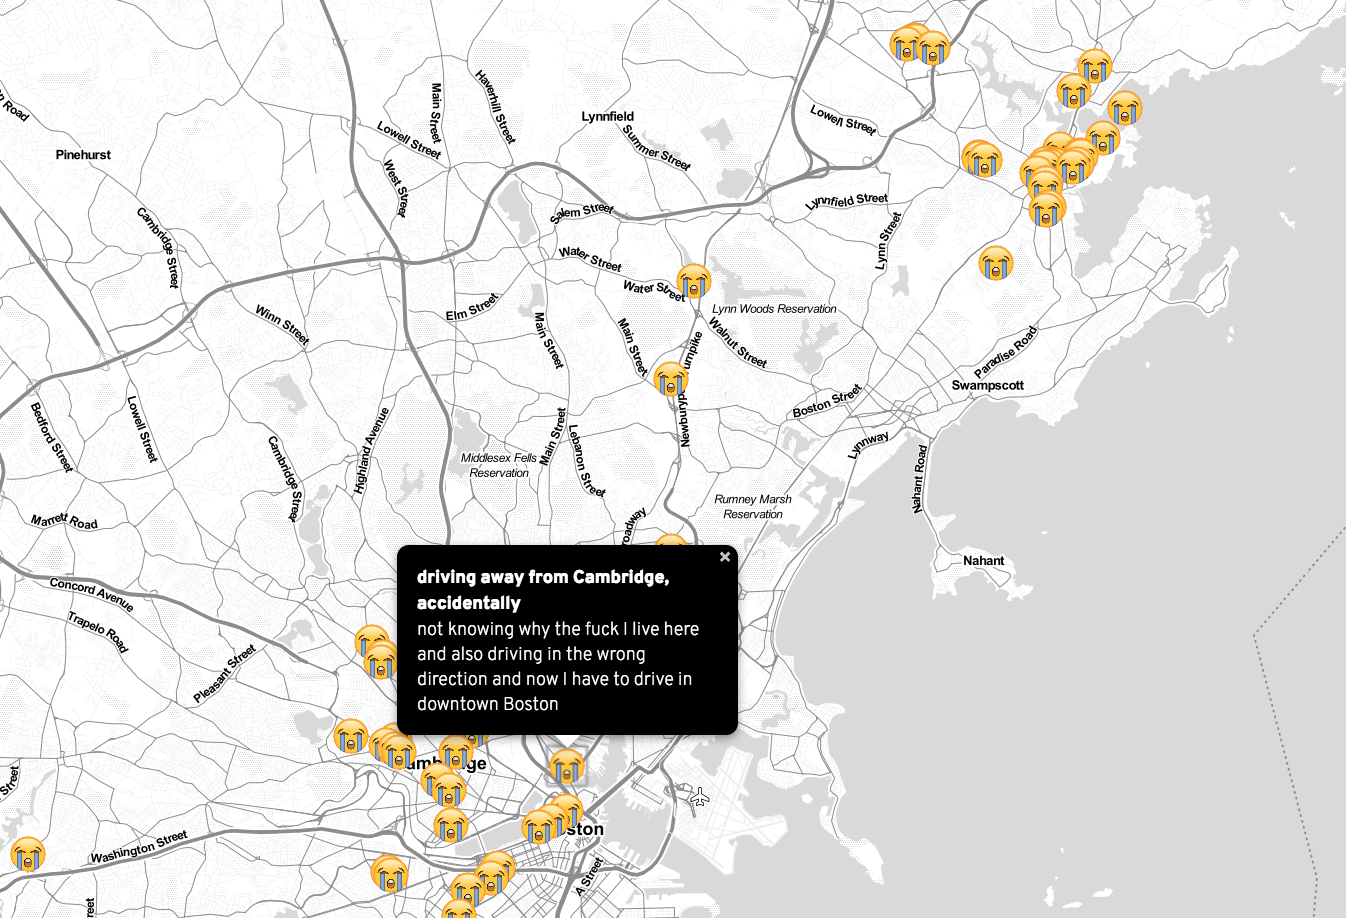
Cry Map: Greater Boston Area, ca. 2010
11 Jun 2017
Last week I was describing the Greater Boston Area as a city I’ve pretty much cried all over. I didn’t live there for very long (and not consistently, either, so this time period is really little sections of mostly 2008, 2010, and 2012…I think). But when I did live there, I was notably very weepy. So I mapped it out and my description was… not wrong. I cried all over multiple cities, constantly. And it’s interesting, I think, to see all of these memories put on a map, just my own personal memories of places. Millions have people have memories of the going to the Trader Joe’s in Coolidge Corner, but my memory happens to be about crying over avocados and/or trying to process feelings associated with having been swiftly dumped.
At this point, I guess you’re already like “Oh! Gosh! Ashley! You poor thing, I am so sorry!” But don’t worry about it! I wouldn’t be doing this if I was still rolling around a little pit of sorrow. At this point in my life, it’s just personal data. And now I can bundle and transfer all of that melodrama to you, dear reader. This will be worse for you than for me. Plus, to assuage you even more, I know from past/current projects that it’s powerful to expose one’s former vulnerabilities when at the appropriately distanced vantage point. I guess I could have made a “great times!” map, but where’s the fun in that?
Anyway, let’s talk about technical things now.
I got to work creating all of these data points from memory via geojson.io, strolling down different memory lanes. This was an interesting memory exercise, how good or not-good I was at remembering where things were and identifying them on a map (and then deciding if I’d purposefully change the location slightly). I could pinpoint a birthday party I went to in Somerville almost to the block just based on feelings looking at the map but had no idea how to find an apartment that I lived in for 3 months. I had to look up the address and only then realized I was basing the location on a commute I used to have, and I was mentally calculating walking in the other direction (maybe this is also because Boston is the worst and based on horse trails instead of using grid-like reason).
Whoops! That still wasn’t technical. Really, there wasn’t that much to do. I set up a one-page webpage with very sparse CSS and relied on Leaflet and leaflet-ajax to show and style the map. It’s not much more complex than their geojson example documentation. Instead of the default OpenStreetMaps, I swapped it out with something more moody here and added a custom icon of the crying emoji. Sorry, you come here for technical blog posts and I don’t deliver and you just end up finding out I once cried in a warehouse parking lot in Peabody after an ex-boyfriend forcibly took my car keys and left me there. Errr, source code is available here.
So, anyway, at your own inevitably-cringing risk: Cry Map, Greater Boston Area, ca. 2010!
P.S., N.B., I will gladly help you make your own Cry Map – just get your geojson in order!
